Categories
Trading blogs

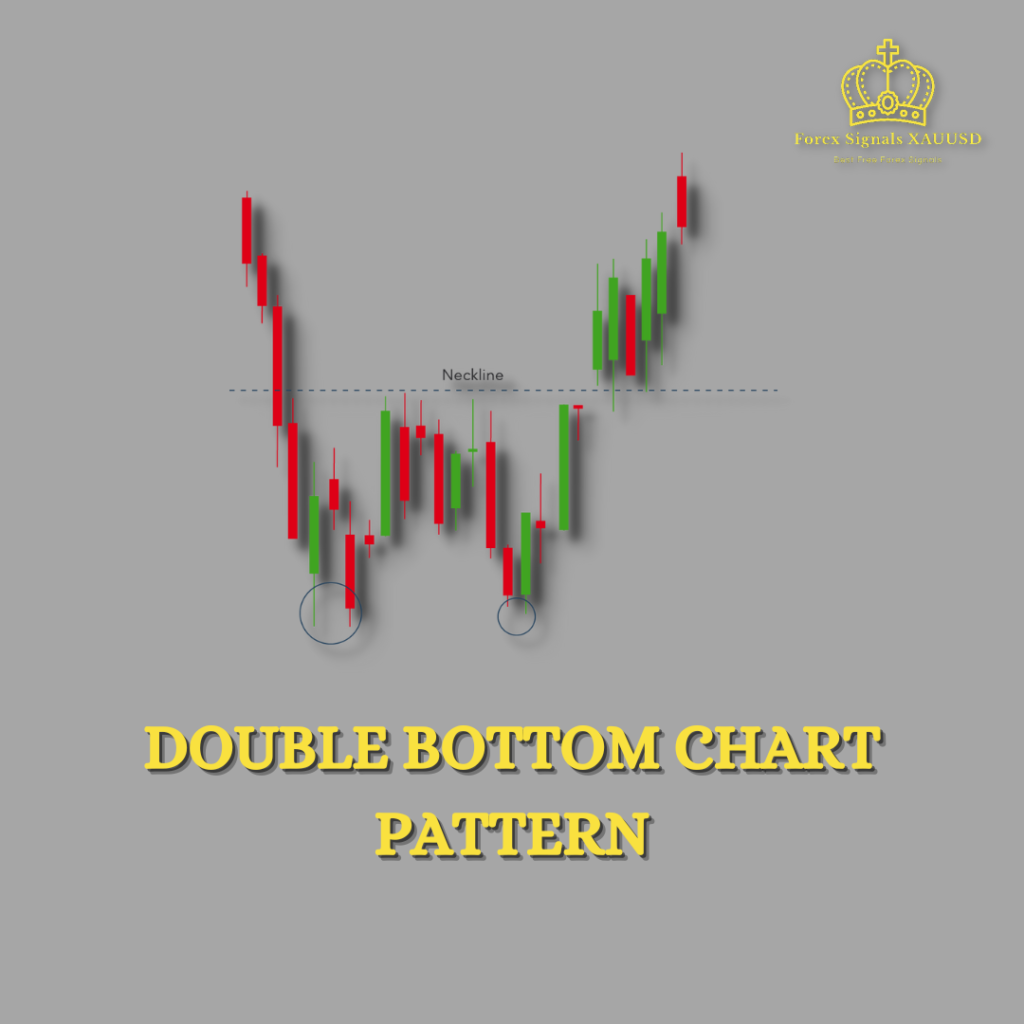
Double Bottom Chart Pattern: A Powerful Tool for Technical Analysis

What Is Double Bottom Chart Pattern? & How You Can Master It:

The Double Bottom chart pattern is one of the most popular chart patterns used by traders and technical analysts to identify potential trend reversals. This pattern is formed after a prolonged downtrend, indicating that the stock or asset has reached its bottom and is now ready to turn bullish. The Double Bottom pattern consists of two consecutive lows that are roughly equal in height, with a moderate peak in between them.

To understand the Double Bottom chart pattern, it is essential to understand the psychology behind it. After a prolonged downtrend, the bears have exhausted their selling power, and the bulls are now starting to enter the market. As the bulls start buying, the price starts to rise, creating the first low of the pattern. However, the bears soon re-enter the market, pushing the price down again, creating the moderate peak in between the two lows. As the price falls again, the bulls enter once again, creating the second low of the pattern. This second low is usually accompanied by a surge in volume, indicating strong buying pressure and a possible trend reversal.

The Double Bottom pattern is considered complete when the price breaks above the moderate peak, signaling the beginning of a new uptrend. The breakout should be accompanied by a surge in volume, indicating strong buying interest and a confirmation of the pattern. The upside price target for the Double Bottom pattern is calculated by measuring the distance from the moderate peak to the lows and adding that distance to the breakout point.

There are several important factors to consider when trading the Double Bottom chart pattern. Firstly, it is important to look for a clear and distinct pattern, with two lows that are roughly equal in height and a moderate peak in between. The more defined the pattern, the higher the probability of a successful breakout. Secondly, it is important to pay attention to volume, which should surge on the second low and the breakout. High volume confirms the pattern and provides additional momentum for the breakout.

Another important consideration is the timeframe in which the pattern is forming. The longer the timeframe, the more significant the pattern is likely to be. Therefore, traders should look for Double Bottom patterns forming on daily or weekly charts rather than intraday charts. Additionally, it is important to consider the broader market context, including macroeconomic factors and industry trends. A Double Bottom pattern is more likely to be successful if it forms in a bullish market or a bullish industry sector.

Trading the Double Bottom chart pattern requires a disciplined approach and a clear set of rules for entry and exit. Traders should enter a long position after the breakout, placing a stop loss below the second low of the pattern. The price target should be based on the measured move of the pattern, with profits taken at that level or at a predetermined exit point. It is also important to monitor the trade closely and adjust the stop loss and profit target as the trade progresses.

Double Bottom Pattern
Double Bottom Candlestick Pattern

In conclusion, the Double Bottom chart pattern is a powerful tool for identifying potential trend reversals and entry points for long positions. Traders should look for clear and defined patterns, with high volume on the second low and the breakout. The timeframe, broader market context, and disciplined approach to trading are all important factors to consider when trading the Double Bottom pattern. With careful analysis and a disciplined approach, the Double Bottom pattern can be a highly effective tool for generating profits in the financial markets.

Example Of Double Bottom Chart Pattern:

Let’s consider an example of a Double Bottom chart pattern in a stock.

Suppose we are looking at the daily chart of XYZ stock, which has been in a prolonged downtrend for several months. The stock has been making lower lows and lower highs, and the price has been steadily declining. However, over the past few weeks, we notice that the price has started to stabilize, and a Double Bottom pattern is beginning to form.

On the chart, we can see that the stock has formed two distinct lows that are roughly equal in height, with a moderate peak in between them. The first low was formed at $50, and the second low was formed at $51, with a moderate peak at $53. The volume during the formation of the pattern was relatively low, indicating a lack of conviction from buyers or sellers.

However, as the price approaches the moderate peak, we notice a surge in volume, indicating strong buying interest. The price breaks above the moderate peak at $53 on high volume, confirming the Double Bottom pattern. Traders who had been waiting for the breakout would now enter a long position, with a stop loss below the second low at $51.

The upside price target for the Double Bottom pattern is calculated by measuring the distance from the moderate peak at $53 to the lows at $50 and $51, which is $3. This distance is then added to the breakout point at $53, giving us an upside target of $56.

As the price continues to rise, traders who entered at the breakout would continue to monitor the trade, adjusting the stop loss and profit target as necessary. If the price reaches the upside target of $56, traders could take profits or continue to hold the position, depending on their individual trading strategy and risk tolerance.

In this example, the Double Bottom chart pattern provided a clear signal for a potential trend reversal and an entry point for a long position. The breakout above the moderate peak on high volume confirmed the pattern and provided additional momentum for the uptrend. By following a disciplined approach and closely monitoring the trade, traders could generate profits from the Double Bottom pattern in XYZ stock.

Categories
Trading blogs

Only 5% Forex Traders Succeed!

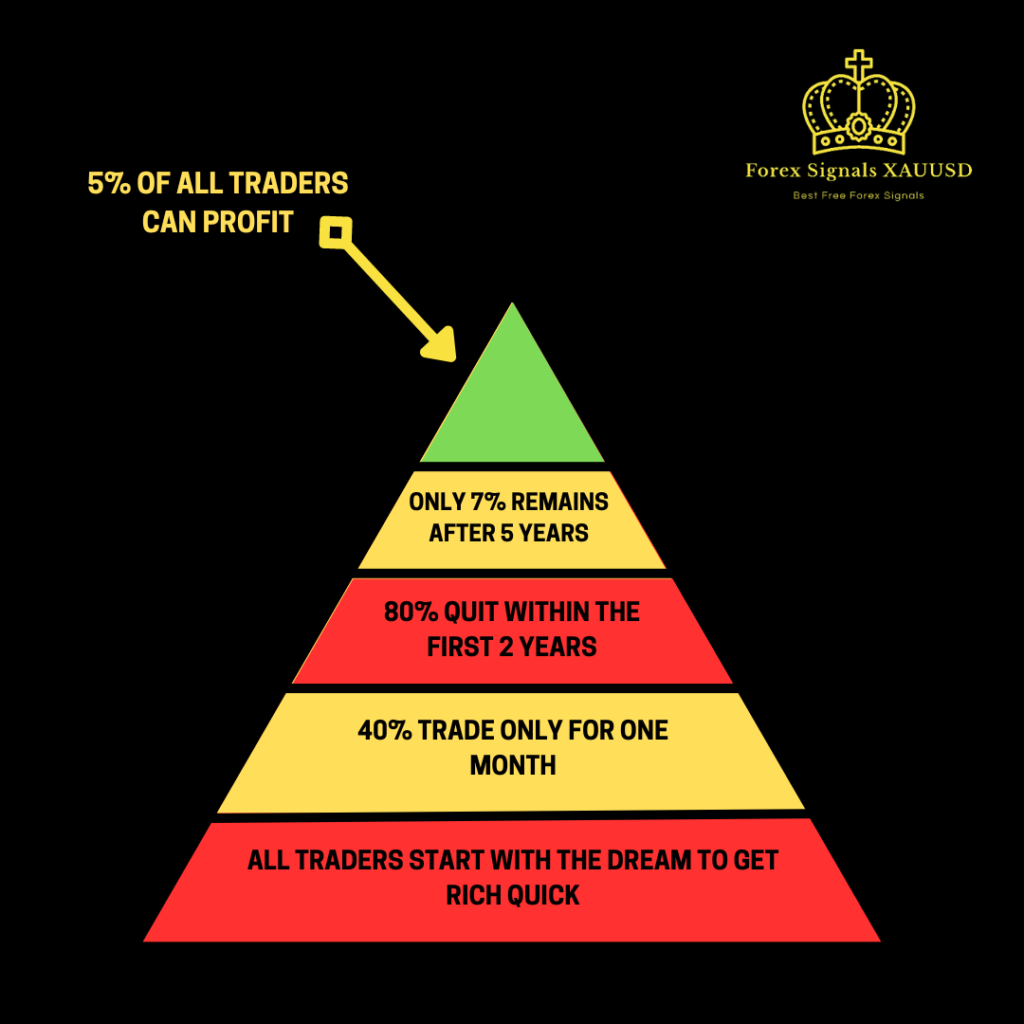
Forex Trading, Also Known As Foreign Exchange Trading, Is The Practice Of Buying And Selling Currencies To Make A Profit. It Is A Highly Volatile And Complex Market, With Trillions Of Dollars Traded Every Day. While Some Traders Manage To Make Consistent Profits, The Majority Of Traders Fail To Do So. In Fact, It Is Estimated That As Many As 95% Of Forex Traders Fail In Consistently Making Profits. In This Blog, We Will Explore Some Of The Reasons Behind This High Failure Rate.

  1. Lack of Knowledge and Experience

One of the most common reasons for Forex trading failure is a lack of knowledge and experience. Many traders jump into the market without having a proper understanding of the market and the trading strategies. They fail to research the market, the currencies they are trading, and the economic factors that affect the market. This lack of knowledge and experience can lead to not so good trading decisions and at the end, losses.

  1. Overtrading

Another reason for Forex trading failure is overtrading. Many traders get caught up in the excitement of the market and trade too frequently. They make trades based on emotions rather than logic, and end up making impulsive decisions. Remember MARKET IS NOT SAME EVERYDAY SO DON’T ASSUME IF SOMETHING WORKED OUT YESTERDAY IT WILL WORK OUT TODAY AS WELL. Losing patience can result in significant losses.

  1. Lack of Discipline

Discipline is a MUST-HAVE skill in Forex trading. Many traders lack the discipline needed to stick to a trading plan and follow a set of rules. They may make impulsive trades or fail to cut their losses when needed. Lack of discipline can lead to undisciplined trading. A great trading plan is needed to succeed consistently in forex trading and to keep following that plan you need Discipline!

  1. Failure to Manage Risk

Risk management is essential in Forex trading. Many traders fail to manage their risk properly and because of overtrading they lose their hard earned equity and profits they have made. Traders need to understand the risk involved in each trade and have a proper risk management strategy in place. They should also avoid trading with money they cannot afford to lose.

  1. Overconfidence

Overconfidence is another reason why many Forex traders fail. Traders who have experienced success in the market may become overconfident and take unnecessary risks. They may also fail to reassess their strategies and adjust to changes in the market. Overconfidence can lead to overtrading and excessive risk-taking, they end up losing their money.

In conclusion, Forex trading is a highly competitive and complex market. Success in Forex trading requires knowledge, experience, discipline, and risk management. Traders who lack any of these attributes are likely to fail in consistently making profits. By avoiding the common mistakes mentioned above, traders can increase their chances of success in Forex trading.

Ultimate Solution For This Is To Join Our Free Signals Channel We Use A Proven Formula To Manage Risk And Make Sure You Always End Up In Profits. We Have Been Profitable Since We Have Started, No Secret Sauce Here We Just Stick To Our Formula And Make Sure You Never Lose A Single Penny Of Your Hard Earned Money!