Candlestick Types: A Visual Guide to Trading Patterns
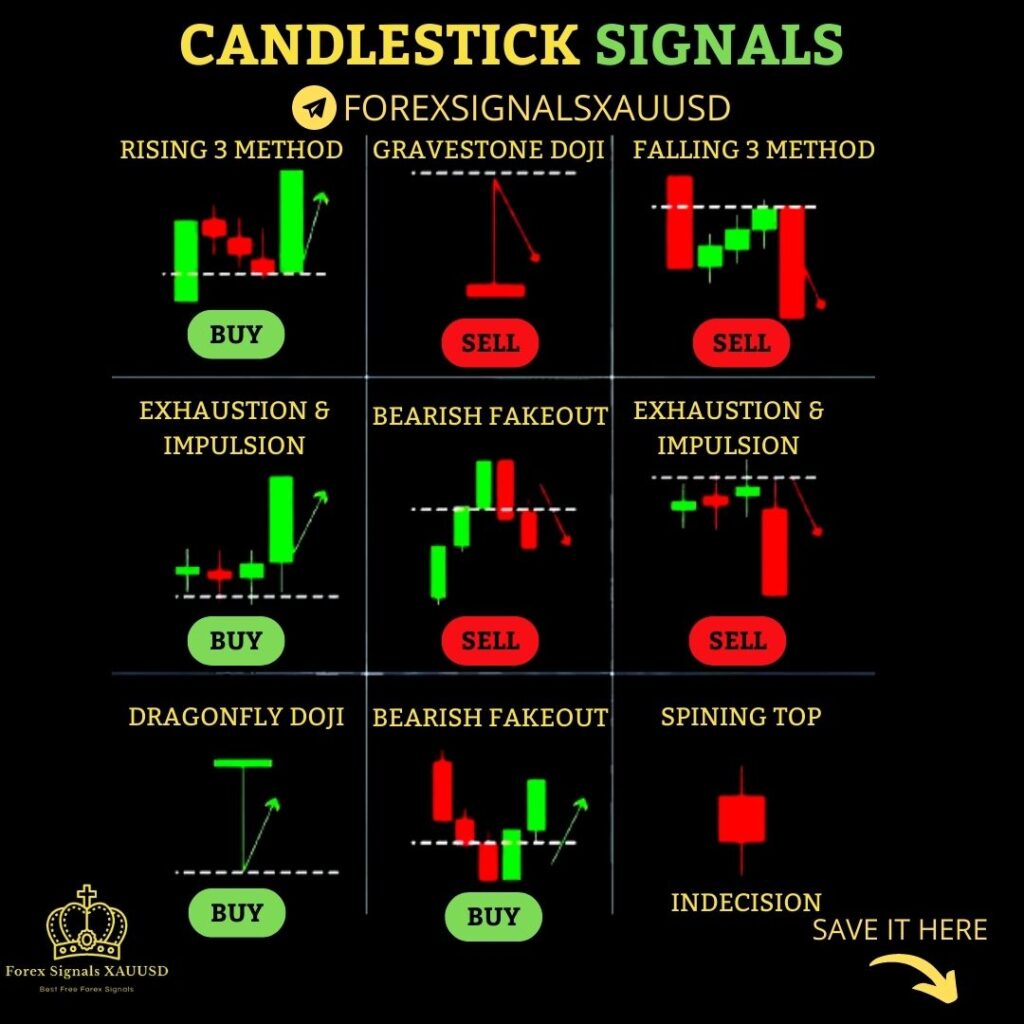
Candlestick Types: A Visual Guide to Trading Patterns The Rising Three Method is a technical analysis pattern used in trading […]
Candlestick Types: A Visual Guide to Trading Patterns The Rising Three Method is a technical analysis pattern used in trading […]
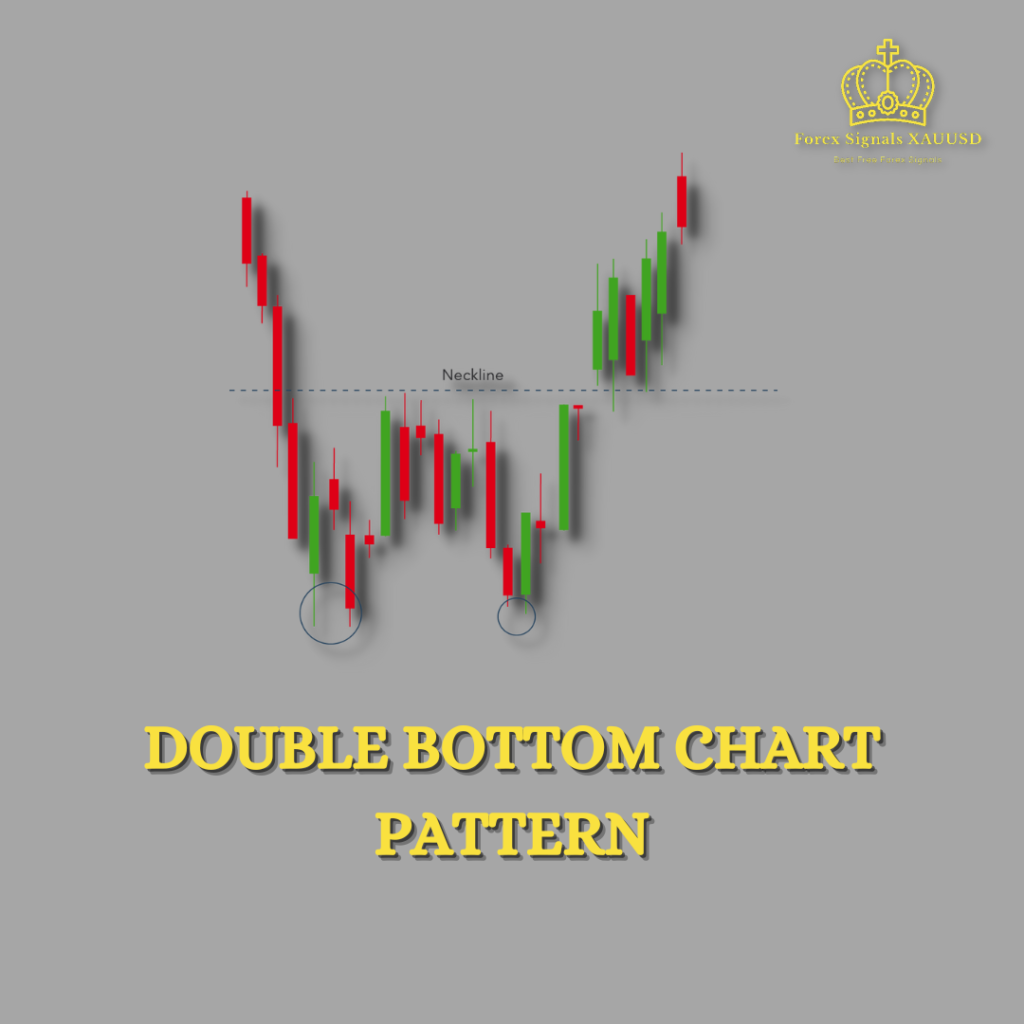
What Is Double Bottom Chart Pattern? & How You Can Master It: The Double Bottom chart pattern is one of
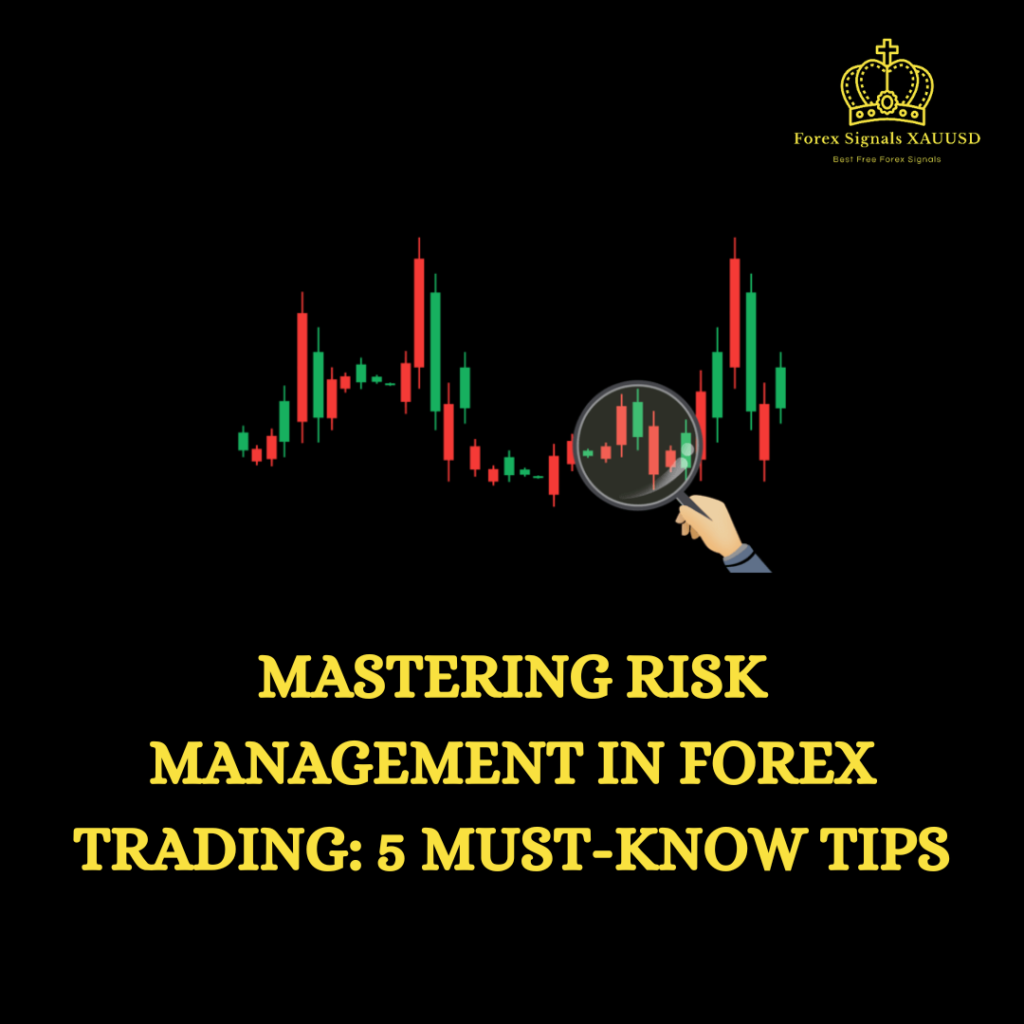
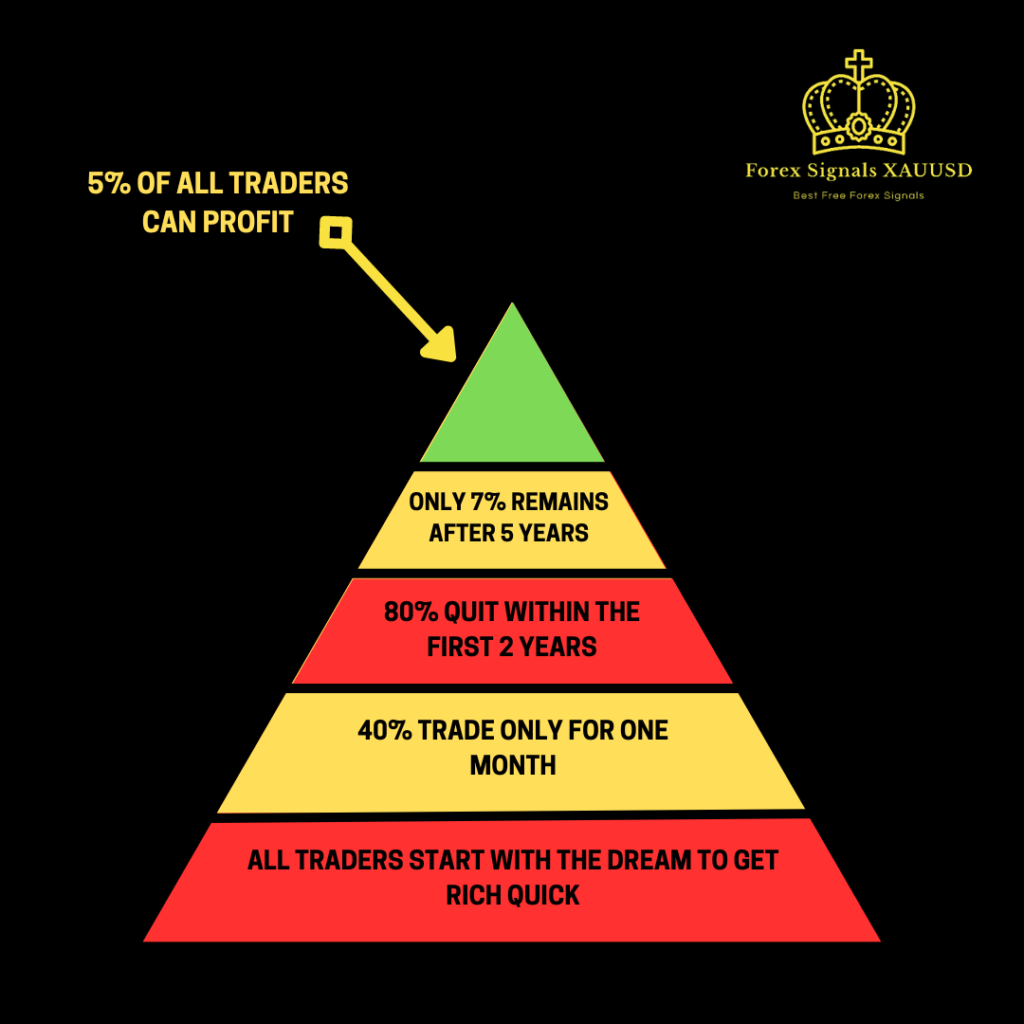
Forex Trading Is A High-risk Activity That Can Lead To Massive Losses If Not Managed Properly. Therefore Risk Management Is
Forex Trading, Also Known As Foreign Exchange Trading, Is The Practice Of Buying And Selling Currencies To Make A Profit.