What Is Double Bottom Chart Pattern? & How You Can Master It:
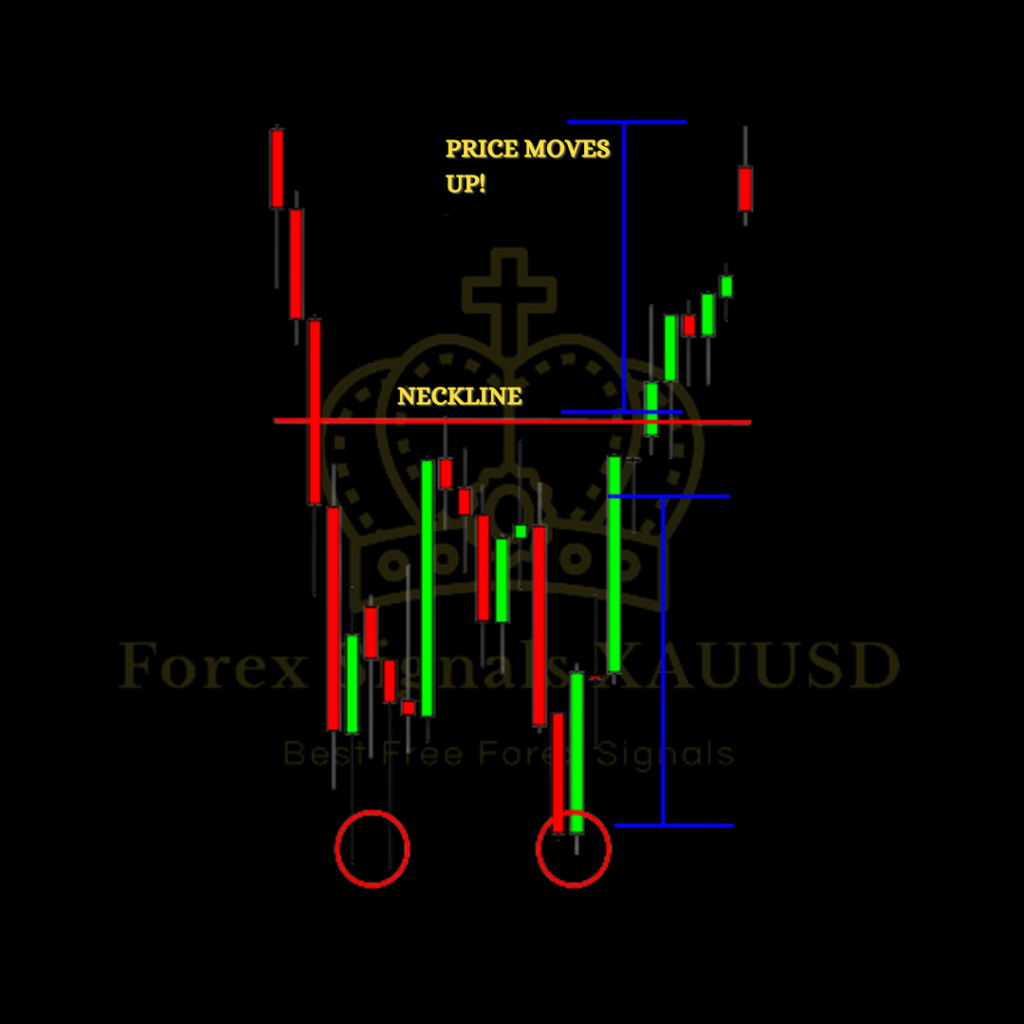
The Double Bottom chart pattern is one of the most popular chart patterns used by traders and technical analysts to identify potential trend reversals. This pattern is formed after a prolonged downtrend, indicating that the stock or asset has reached its bottom and is now ready to turn bullish. The Double Bottom pattern consists of two consecutive lows that are roughly equal in height, with a moderate peak in between them.
To understand the Double Bottom chart pattern, it is essential to understand the psychology behind it. After a prolonged downtrend, the bears have exhausted their selling power, and the bulls are now starting to enter the market. As the bulls start buying, the price starts to rise, creating the first low of the pattern. However, the bears soon re-enter the market, pushing the price down again, creating the moderate peak in between the two lows. As the price falls again, the bulls enter once again, creating the second low of the pattern. This second low is usually accompanied by a surge in volume, indicating strong buying pressure and a possible trend reversal.
The Double Bottom pattern is considered complete when the price breaks above the moderate peak, signaling the beginning of a new uptrend. The breakout should be accompanied by a surge in volume, indicating strong buying interest and a confirmation of the pattern. The upside price target for the Double Bottom pattern is calculated by measuring the distance from the moderate peak to the lows and adding that distance to the breakout point.
There are several important factors to consider when trading the Double Bottom chart pattern. Firstly, it is important to look for a clear and distinct pattern, with two lows that are roughly equal in height and a moderate peak in between. The more defined the pattern, the higher the probability of a successful breakout. Secondly, it is important to pay attention to volume, which should surge on the second low and the breakout. High volume confirms the pattern and provides additional momentum for the breakout.
Another important consideration is the timeframe in which the pattern is forming. The longer the timeframe, the more significant the pattern is likely to be. Therefore, traders should look for Double Bottom patterns forming on daily or weekly charts rather than intraday charts. Additionally, it is important to consider the broader market context, including macroeconomic factors and industry trends. A Double Bottom pattern is more likely to be successful if it forms in a bullish market or a bullish industry sector.
Trading the Double Bottom chart pattern requires a disciplined approach and a clear set of rules for entry and exit. Traders should enter a long position after the breakout, placing a stop loss below the second low of the pattern. The price target should be based on the measured move of the pattern, with profits taken at that level or at a predetermined exit point. It is also important to monitor the trade closely and adjust the stop loss and profit target as the trade progresses.

In conclusion, the Double Bottom chart pattern is a powerful tool for identifying potential trend reversals and entry points for long positions. Traders should look for clear and defined patterns, with high volume on the second low and the breakout. The timeframe, broader market context, and disciplined approach to trading are all important factors to consider when trading the Double Bottom pattern. With careful analysis and a disciplined approach, the Double Bottom pattern can be a highly effective tool for generating profits in the financial markets.
Example Of Double Bottom Chart Pattern:
Let’s consider an example of a Double Bottom chart pattern in a stock.
Suppose we are looking at the daily chart of XYZ stock, which has been in a prolonged downtrend for several months. The stock has been making lower lows and lower highs, and the price has been steadily declining. However, over the past few weeks, we notice that the price has started to stabilize, and a Double Bottom pattern is beginning to form.
On the chart, we can see that the stock has formed two distinct lows that are roughly equal in height, with a moderate peak in between them. The first low was formed at $50, and the second low was formed at $51, with a moderate peak at $53. The volume during the formation of the pattern was relatively low, indicating a lack of conviction from buyers or sellers.
However, as the price approaches the moderate peak, we notice a surge in volume, indicating strong buying interest. The price breaks above the moderate peak at $53 on high volume, confirming the Double Bottom pattern. Traders who had been waiting for the breakout would now enter a long position, with a stop loss below the second low at $51.
The upside price target for the Double Bottom pattern is calculated by measuring the distance from the moderate peak at $53 to the lows at $50 and $51, which is $3. This distance is then added to the breakout point at $53, giving us an upside target of $56.
As the price continues to rise, traders who entered at the breakout would continue to monitor the trade, adjusting the stop loss and profit target as necessary. If the price reaches the upside target of $56, traders could take profits or continue to hold the position, depending on their individual trading strategy and risk tolerance.
In this example, the Double Bottom chart pattern provided a clear signal for a potential trend reversal and an entry point for a long position. The breakout above the moderate peak on high volume confirmed the pattern and provided additional momentum for the uptrend. By following a disciplined approach and closely monitoring the trade, traders could generate profits from the Double Bottom pattern in XYZ stock.